Market Elasticity, Liquidity Crises, and the “Fed Put”
May 2021
Financial market participants often evaluate risk-reward optimization problems of investment opportunities more or less independently from the market structure setting that makes these investments possible. The underlying assumption is that the market structure industry does a good job when public markets provide a robust, accurate, and liquid realization of the “fair” return distributions produced by available information on securities, thereby allowing for optimal and actionable capital allocation outcomes in an economy. However, a question I hope to address in this note is the extent to which specific forces within market structure can themselves causally contribute to these return distributions, given prices reflect transactions and not purely information. My aim is therefore to demonstrate that the changing roles and incentives of asset managers, market makers, hedge funds, exchanges, etc. should be considered not only for the implementation but also for the core risk-reward calculus of investments.
I will first focus on retracing theoretically and empirically how the composition and shape of equity returns are impacted by the gradual rise of passive investing and the recently heightened aversion of liquidity providers to volatility. Next, I will assess how these market structure developments interact with and can catalyze price effects both of central bank intervention and of investor reaction functions to thus formed return expectations.
Overview
In the last 20 years, domestic equity markets in particular underwent dramatic shifts in the nature of demand for investment management (advent of passive investing) and supply of liquidity provision (advent of high-frequency trading and implementation of Volcker). While on the surface these shifts have helped generate a compression of average investment fees and bid-offer spreads, I will try to show how they are also stripping the market of its buffering mechanisms to prevent convex price movements, such that first order benefits are actually masking deeper, second-order fragilities. Regarding the shift in investment management, I will focus on how the rising share of index-replication reduces market elasticity by crowding out active investors who are able to step into markets to exploit volatility-induced dislocations from fundamental value. Instead, passive products populate the market with price-indiscriminate “macro” decisions typically motivated by household behavior (e.g. a certain percentage wealth allocation to equities) rather than informed return expectations. I will also explore how the dominant market capitalization weighting mechanism of passive vehicles drives relative price distortions between largest and smallest constituents, increasing index concentration risk and diminishing diversification benefits. Regarding the shift in liquidity provision, I will evaluate the considerable sensitivity of liquidity to spikes in volatility since 2018 and how this seems to have permanently impaired US equity market depth. In search of an explanation for these statistics, I will consider both an endogenous theoretical framework — how price trends/volatility can cause destabilizing feedback loops for market makers — and a pertinent regulatory impact — how the Volcker rule reduces broker dealer market making activity and hedge fund liquidity exposure. The overarching goal is to illustrate a market structure setting that is becoming more and more prone to extreme price movements — without presumption of an intrinsic directional bias — because it is proportionally gaining investors that do not trade on fundamental information (but rather orthogonally across asset classes, e.g. between cash and market-weighted equities) and liquidity providers who are unwilling or unable to underwrite market depth when confronted with price volatility.
I also wish to briefly reconcile these fragility implications with the very strong equity market returns and passive outperformance we have seen since the great financial crisis. While most of these returns were accompanied by a thriving economy, in 2020 US equity prices decoupled noticeably from their underlying, COVID-suppressed earnings. This accelerated the trend in multiple expansion we have seen throughout the last ten years, and came hand-in-hand with an unprecedented scale and scope of open market intervention by the Federal Reserve. Critically, the “Fed put” modifies how investors in search for yield act on their risk preferences (for more detail, please see my note from last year) and associated rate cuts force target-date funds, a highly popular retirement product, to rebalance by purchasing equities. As a result, I believe a key driver behind the valuation gains in US equity markets is the upward bias that Fed purchases have exerted, both through risk preferences and mechanically, on an increasingly multiplicative market structure machine. The divergence of prices and fundamentals was exacerbated during COVID, as record levels of central bank support, passive ownership, and lack of market depth pushed this catalysis-like dynamic to new extremes.
Central to an assessment of future equity returns is therefore the forward-looking question whether by reaching a zero rate lower bound and record balance sheet size, the Fed has exhausted its ability to support markets as effectively. I will consider how the market structure setting has indoctrinated particularly millennial investors in the to-date successes of passive strategies and momentum. The danger lies in the incubation of misperceptions around both sustainability of high average returns (a function of entry point valuations, which are currently elevated) and our ability to fully capture these returns (probabilistically, a distinction of group success from individual success, given the latter can face points of ruin). If the “Fed put” fades and passive outperformance thus loses a key benefactor, then the clash of lofty, market-wide investor expectations with a sober, FCF-bound, company/sector-differentiated reality can incite a risk-off and investment style rotation. Per above analysis, the price impact of ensuing and concurrent flows will be substantially amplified by the market’s structural inelasticity, concentration, and volatility-reflexive illiquidity.
Rise and Implications of Passive Management
An inescapable trend in investing that has accelerated markedly since the great financial crisis is the proportional transition from active to passive management. Per estimates by the Boston Federal Reserve1, in March 2020 passive funds in the domestic equity market reached a 14% share across all investor types and a 48% share across mutual funds and ETFs. The underlying motivation for passive investing is simple and powerful: net alpha across an entire marketplace should be zero2. Therefore, on average active management will not earn an outperformance that justifies its management fees. Meanwhile passive investing is cheap because it does not require research-based contribution to price discovery, thus ‘free-riding’ others’ work. As a result, investors should be better off simply owning the equity universe with security allocations that exploit the intelligence implied in market-weighting, as opposed to going for targeted bets within the universe that require fair value modeling. Jack Bogle, founder of Vanguard, thus pioneered the first index mutual fund in 1976 and famously proclaimed: “Don’t look for the needle — buy the haystack!”3. Today Vanguard stands at $7 trillion AUM and the power of Bogle’s diversification has made index-replication a go-to investing strategy for many retail and institutional investors. Additionally, given the demand for an exchange-traded solution paired with the impracticality of purchasing 500 stocks to replicate the S&P500, the market structure industry also offers a compelling, cheaper alternative to mutual funds: ETFs. ETFs optimize liquidity relative to index holdings that comprise potentially large numbers of constituents by utilizing a smooth arbitrage mechanism run by market makers called Authorized Participants (“APs”). APs can create/redeem ETF shares by delivering/receiving the basket that the shares represent, thus minimizing spreads of ETF prices to NAV. Fast forward to today, Vanguard’s S&P500 ETF “VOO” charges an expense ratio of 0.03% and trades at a 30-day average bid/offer spread of 0.01% and premium to NAV of 0.02%4. The takeaway: it has never been as cheap and easy to invest (a small amount of) money into the United States’ largest 500 listed companies, with passive ETFs at the frontier of this cost-efficiency.

While optically the value proposition of passive instruments for investors has built a very convincing track record, their consequences on asset pricing have received less attention. Part of the problem is that like so often in finance we do not have a clean, bivariate way to statistically measure the real-world impact of index-replication on stock price discovery, and are thus bound to a rather conceptual (but hopefully directionally correct) analysis. Another part is that such analysis, when it is conducted, typically tries to identify price impact in the first moment, rather than in the higher moments, of securities’ return distributions. My aim is to argue that passive management does not necessarily create an upwards or downwards bias on market prices in its own right, but rather that it enables greater volatility and fatter tails in the presence of skewed flows by means of fostering market inelasticity and index concentration risk.
What do we mean by and how do we measure inelastic markets? In their March 2021 paper “In Search of the Origins of Financial Fluctuations: The Inelastic Markets Hypothesis”5, authors Gabaix and Koijen try to show that markets exhibit low reactivity of demand (supply) to increases (decreases) in stock prices, such that “flows in and out of the stock market have large impacts on price”. By testing the impact of idiosyncratic demand shocks as a source of exogenous variation on aggregate prices, Gabaix and Koijen estimate theoretically and empirically (in US markets via Flow of Funds and 13F reports) that when an investor sells $1 of bonds to buy $1 of stocks, this raises the stock market valuation by ~$5 (implying elasticity of ~0.2). Notably the bulk of equity return variance, at 54%, is driven by households. They also find that price impacts are long-lasting, “not because flows release information, but simply because the permanent shift in demand for stocks must create a permanent shift in their equilibrium price”. This all stands in obvious contrast with the efficient markets hypothesis, which dictates that prices should reflect the PV of future dividends. The authors hypothesize that inelasticity arises because (1) many funds, due to their mandates, cannot discriminately supply stocks when demand rises, (2) that transfer of equity risk across investor sectors is small and positions hence sticky (i.e. gross and net flows are of similar magnitude), and (3) that since micro-elasticity has been estimated at ~1.0, this should be an upper bound for macro-elasticity. Especially (1) and (2) bear important connections to passive instruments, as they have strict mandates to turn cash into a basket that tracks the replicated index, without need for investors to rebalance thereafter.
Key is the idea that passive instruments, by design, lend themselves well to investment decisions motivated by a desire for certain asset class “haystack” exposures — e.g. rotating from investment grade bonds to large cap stocks, which is likely guided by a much more general rationale than rotating from say Microsoft to Apple. In fact, instead of making return predictions, households have historically maintained a surprisingly stable wealth allocation to equities; when we receive a bonus check, a natural impulse is to put part of it in the stock market, largely without a deeper, high-conviction assessment on valuation. Importantly, this inspires Samuelson’s dictum that markets are macro-inefficient while micro-efficient, and gives rise to the market inelasticity uncovered by Gabaix and Koijen; relative value between asset classes is much harder to assess than between individual securities, such that “macro” buy/sell decisions are less informed and constitute demand/supply functions that are less reactive to price gains/drops. Prices thus reflect transactions, not only information6. And passive instruments have become the dominant conduit of such macro decisions, especially for return variance-driving households. As a result, when we shift more AUM from active to passive management, we deprive the market of investors who have sufficient mandate flexibility to trade on the signal that market and estimated fundamental value of securities are diverging. Instead, we gain participants whose buy and sell motivations cater to linear conversions between cash and diversified securities baskets at any price, thus stripping the market of a core buffering mechanism and raising the multiplier effect of flows on prices.
While our evaluation of elasticity is mainly concerned with aggregate market valuations, we also need to consider how a central mechanism of passive investing — market weighting — can create relative pricing distortions. A highly popular ETF like VOO owns all stocks in the S&P500, with weightings based on each company’s float-adjusted market capitalization. In their December 2020 paper “Tracking Biased Weights: Asset Pricing Implications of Value-Weighted Indexing”7, authors Jiang, Vayanos, and Zheng find empirically that “flows into funds tracking the S&P500 index raise disproportionately the prices of large-capitalization stocks in the index relative to the price of the index’s small stocks”. Passive flows thus predict higher returns for a small-minus-large size factor portfolio. Crucially, the authors also find evidence that this effect is largely contained within the S&P500, which attracts the lion’s share of passive equity assets; outside the S&P500, the effect is “smaller and statistically insignificant”. In a CAPM world, this size effect should not hold under any index partitioning, given smaller stocks’ higher beta. However, when we add the presence of sentiment-driven noise traders, we can also reconcile theoretically how “stocks in high demand by noise traders are overvalued and enter with high weights into value-weighted indices”, thus creating large cap momentum but ultimately pushing down their expected return (Tesla’s December 2020 addition to the S&P500 comes to mind). And when passive instruments then receive inflows and blindly accept market weights as ‘correct’, they exacerbate these relative distortions.
Jiang et al hence show us how theoretical prices skewed by sub-rational noise traders and perpetuated by market-weighted investment products can model an observed causality between passive inflows and disproportionate price gains in the largest index constituents. The positive impact on index concentration — with e.g. the S&P500’s top five companies currently making up ~22% of the index8 — attacks the very heart of Bogle’s premise: that indexes offer diversification of idiosyncratic, company-specific risks. As a result, this leads us to an additional vulnerability introduced by the rise of passive investing. While the crowding out of active participants makes markets less elastic, the replication of market weightings invites size effects that make indexes top-heavy.
Deterioration of Market Liquidity
The second market structure development I wish to address is the market’s increasing difficulty to absorb large orders without price impact. Even though average bid-offer spreads available to small orders are low — courtesy of high frequency traders — the resting capacity on behalf of liquidity providers has deteriorated in the last three years. What is specifically worrisome is any convexity where market depth falls non-linearly relative to prices. These conditions imply reflexivity in volatility and illiquidity, as e.g. large price drops lead to thinner order books which in turn can amplify further price drops relative to selling flows. I will begin by showing a few statistics around developments in market depth and its observed connection to volatility, alongside bid-offer spreads. To try and explain these developments, I will then evaluate two possible explanations: endogenously, how price volatility/trends can create destabilizing feedback loops for liquidity providers, and exogenously, the restrictive effect of the Volcker Rule on market making activity by banks and hedge funds.
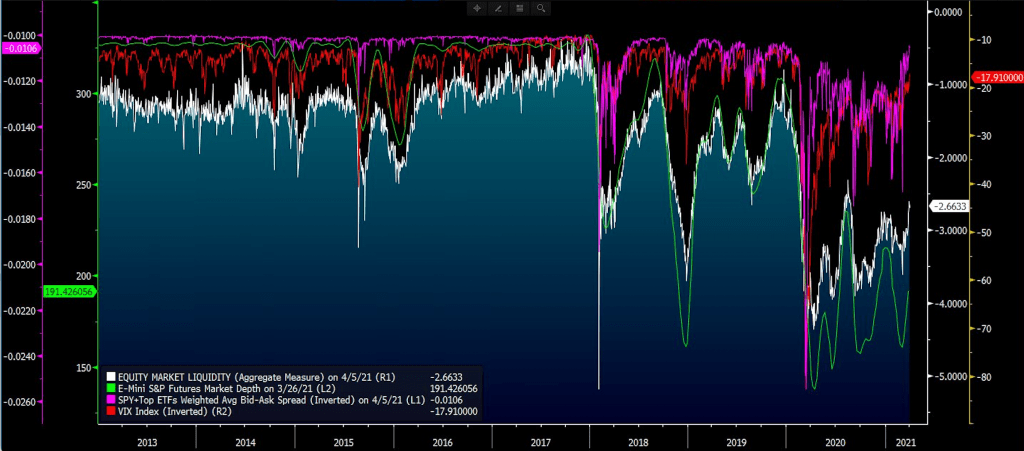
The first graph9 shows an aggregate Bloomberg-based estimate for equity market liquidity (white), S&P futures depth (green), inverted average top US ETF bid-offer spreads (pink), and inverted VIX (red). The 2013-2017 period largely saw stability across these measures, but conditions became rapidly worse in early 2018 due to a catalyst that has informally been dubbed “Volmageddon”. This was an event in February 2018 during which exchange-traded short volatility products experienced complete or near-complete losses because their rebalancing mechanisms in VIX futures created positive feedback loops that in turn effected an explosion in implied volatility levels. As a result, the highly popular XIV by Credit Suisse and SVXY by ProShares (at $2bn combined pre-event AuM10) were among the ETFs and ETNs that lost virtually all their value. And even though (outside of skew delta hedging) these issues were technically confined to volatility products, the broader market sold off substantially; the S&P500 declined by 8.5% during the week of Volmageddon. As a result, whether due to its endogenous nature, the way it demonstrated spillover and financial engineering risk, or another factor — this event marked the first inning of what was further perpetuated by subsequent December 2018 and March 2020 sell-offs and by now has turned into a seemingly permanent impairment in liquidity and market depth. Since Volmageddon, these measures have been highly reactive when volatility spikes, but — unlike bid-offer spreads — do not fully recover when volatility subdues.
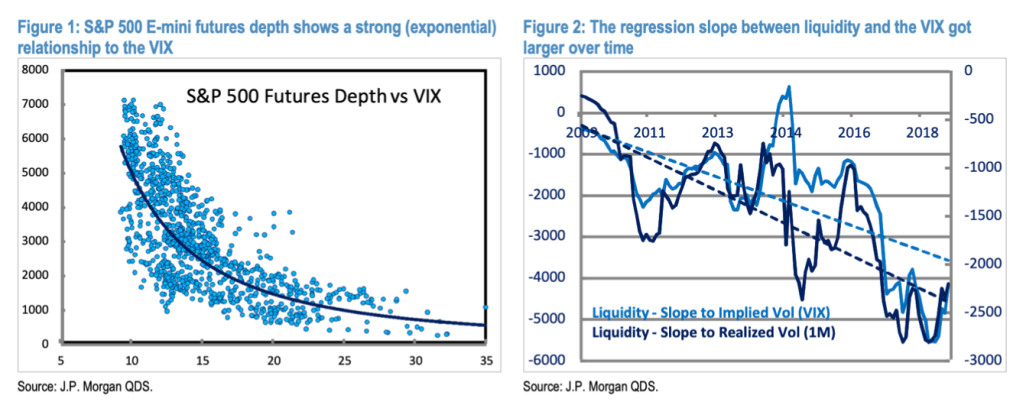
To provide an additional illustration of the liquidity-volatility connection, the second and third graphs11 show data from JP Morgan as of February 2019. The left depicts the strongly negative correlation of S&P500 futures market depth versus the VIX index since 2009, with market depth asymptotically approaching zero at extremely high VIX levels. The right shows how the regression slope between these two variables has become larger over time. Adding data from COVID-19 would exacerbate the relationships shown in both graphs.
Of course, these data do not provide an exhaustive illustration of market participants’ ease or difficulty to execute trades efficiently. The CME, for example, noted in June 2020 that “it is not always valid to assume that a low level of resting volume at the top of the book signifies a lack of liquidity”12, pointing instead to the importance of higher refresh rates. While the CME admits that liquidity took a hit during the March 2020 sell-off, it argues that book depth takes lower priority compared to a measure of fill prices versus arrival prices (meaning the prevailing price when the order is submitted). After a closer look at price dispersion data from trading impacts, the CME concludes that liquidity did degrade, but “at logical levels, due to the rapid acceleration in volatility”. I do agree that it is perhaps too extreme to claim liquidity vanished “in an absolute sense” in March 2020, where fill quality did not exhibit the convex degradation that order books in isolation would indicate. However, the heightened sensitivity of price impact to volatility remains a key concern given the convex nature of volatility itself. While the exact magnitude of the relationship is up for debate, the sign of the relationship is not; therefore it should be a worthwhile exercise to try and find explanations for this volatility-liquidity connection.
In their December 2019 paper “Endogenous Liquidity Crises”, authors Fosset, Bouchaud, and Benzaquen analyze feedback mechanisms through which price trends or volatility can cause liquidity breakdowns. As a theoretical underpinning, the Glosten-Milgrom model points to adverse selection as an amplification channel; when “liquidity providers believe the quantity of information revealed by trades exceeds some threshold, there is no longer any value of the bid-ask spread that allows them to break even”13. The authors try to verify this effect both empirically in Eurostoxx futures and via simulations in a stylized order book model. Crucially, in the model they find a “second order phase transition between a stable regime for weak feedback to an unstable regime for strong feedback” — and if the switch occurs, the probability of a liquidity crisis converges to one. The paper thus reconciles reflexivity between liquidity and volatility by showing how dealers’ aversion to information asymmetry can be reconstructed through a two-regime setting, where the latter has explosive features that make liquidity provision suddenly unattractive when confronted with market turbulence.
Whereas these dealer feedback loops are price-based and hence internal to the market, I would also like to consider an external factor: regulation. Initiated as part of Dodd-Frank in 2013, the Volcker Rule “prohibits banks from engaging in short-term proprietary trading,” and imposes “limits on banks’ investments in, and relationships with, hedge funds and private equity funds”14. While market making, underwriting, and hedging are exempt from the rule, many critics worried that a reduced ability by banks to take risk would make them more hesitant to provide liquidity — a phenomenon for which we have some evidence (e.g. Bao et al (2016) in corporate bonds). However, pertinent to our prior analysis of active versus passive in relation to fundamental research and market elasticity, I would also like to touch on the impact of Volcker on hedge funds. In their 2019 paper “The Volcker Rule and the Hedge Fund Liquidity Circle”, authors Kolokolova and Yu find that tighter funding conditions for hedge funds due to Volcker “led to a reduction in hedge funds’ exposure to market liquidity, including a drift towards more liquid investments”15. This effect is strongest for “funds having business connections with the largest US banks targeted by the Rule…as well as those with non-directional investment styles”. Since non-directional funds have long and short components, they are important two-way price-setters when valuations deviate from fundamentals. The authors hence empirically identify warning signs that Volcker has negatively impacted targeting of the liquidity risk factor by hedge funds. Given the Rule was implemented in 2014, the heightened sensitivity to volatility we started seeing in 2018 may therefore be a delayed result of Volcker’s reduction of market structure flexibility on behalf of both dealers and hedge funds, temporarily hidden by calm markets between 2014-2018.
How Market Structure Interacts with Federal Reserve Intervention
The complex interplay of these various market structure forces pushes us into a vulnerable position; when confronted with large price moves, fundamental liquidity providers (like hedge funds) do not step in because they are being crowded out by passive management and their eco-system has been restricted by Volcker, while pure-play liquidity providers (like high frequency traders) step out because by design they do not seek to express opinions on fair value via potentially prolonged balance sheet risk. And although at any given point in time, this asset price fragility introduced by market structure providers does not per se have a directional bias, the multiplicative effect of flows on prices has been incubated in notably strong equity market returns since the great financial crisis, during which passive management achieved record outperformance over active management.
A key driver behind the magnitude, steadiness, and broad nature of these returns — in particular when overcoming deteriorating earnings fundamentals, like in 2020 due to COVID — has been open market operations on behalf of the Federal Reserve, which expanded its balance sheet from $0.9tn in May 2008 to $7.8tn in May 202116 in order to keep interest rates low and to spur inflation and employment. This has had important consequences on the risk preferences of investors in search of yield, which I highlight in detail in my note from mid-2020. At the same time, however, rate cuts also have a powerful mechanical effect via target date funds, which reached $2.3tn in AuM as of year-end 202017. Target date funds seek to maintain a defined percentage allocation split between mostly bonds and stocks using index replication, which is tilted over time as an investor approaches retirement. When the Fed lowers rates, the funds’ bond collateral gains in value, such that the fund needs to purchase equities in order to maintain allocation targets.
Together, this intervention creates Fed-subsidized performance benefits for risk assets not primarily by improving differentiated corporate earnings potential (benefitting active managers), but rather by raising the price/reducing the yield of any alternatives to equities (benefitting passive managers) — notably also pushing institutional investors into (previously shunned) private equity and venture capital investments. In public markets, this contributes to a continued shift in AUM towards passive management and hence to a rise in inelasticity. Altogether, my suspicion is therefore that the upwards price impact of Fed support via zero rates and large scale purchases has been catalyzed by market structure-driven flow-to-price fragility, thereby pushing multiples higher, while at the same time also further deepening this fragility. Meanwhile from a socio-economic perspective, inorganically high multiples can be troubling in their own right: for instance on the speed of policy responses, because optimistic, forward-looking equity markets can distract from problems in the real economy (like in H2 2020), or on economic inequality, because resultant high entry valuations make it much harder to compound wealth.
Expectations vs. Reality in Hypothetical Absence of the “Fed Put”
Lastly, I’d like to turn to a forward-looking question: what happens when (a) modern market structure exhibits significant asset price fragility in the presence of large flows, (b) the “Fed put” now fades given we have reached a zero rate lower bound and forward break-even inflation rates continue rising, but (c) investors expect lofty future risk asset returns because they are anchored to years of strong central bank support and consequently loose financial conditions? Drilling down on (c), in particular younger investor generations seem at risk, because strong markets with momentum and passive strategy outperformance comprise a larger share of their to-date sample sizes. Based on Schroder’s 2020 Global Investor Study18, global millennials expect an average return of nearly 12% on their portfolios in the next five years, and US investors across age groups expect a staggering 15% (with an estimate on specifically US millennials not available, unfortunately).
I would cautiously predict that US investors in particular will struggle to achieve such returns for two reasons, and subsequently express their disappointment through risk reduction. First and most importantly, as outlined in Cliff Assness’ note “The Long Run is Lying to You”, the realized average return of any strategy is not the best estimate of long-term expected return — instead, what “buffets realized average returns is changes in valuations”19. Intuitively, although often neglected today, a higher entry multiple typically implies strong performance during the valuation richening but lower expected returns thereafter. For example, ‘old-school quant’ fund GMO currently predicts 7-year annual US large cap forward returns of -7%; this highlights the penalty imposed on today’s markets when assuming mean-reversion to a long-run steady-state P/E. Second, we should treat the average market return as probabilistically separate (and, under conventional household financial behavior, more as an upper bound) to individual investor returns. Here we can turn to Nassim Taleb’s note “The Logic of Risk Taking”20, where he highlights how likelihood of success applied to groups of people (group probability) does not apply a single person through time (time probability), given individuals can encounter points of ruin from which there is no return. If an investor faces a situation where she needs to reduce exposure because of losses, retirement, etc., then her returns will be divorced from market returns. Given our prior illustration of a market structure setting that is becoming increasingly conducive to high magnitude and velocity price moves, retail investors that have been tempted into large momentum or passive holdings but to some degree have retained their risk aversion may thus be more prone to reduce their positions during drawdowns (or get stopped out due to their record levels in margin debt). It takes conservatism to expect market returns while unperturbed by historical performance, and it takes discipline to ensure that exposure can be maintained when valuations fall.
Conclusion
Risk asset prices therefore do not strictly reflect information about their underlying securities, as is often assumed and relied upon by professionals and amateurs alike when evaluating investment decisions. Instead, prices reflect transactions outputted by the current iteration of a constantly evolving market structure machine, with information on securities marking an important but not an exhaustive input. As I have tried to argue in this note, other factors of growing importance include prevalence of the investment style pursuing the transaction (with passive management driving market inelasticity and size distortions) and volatility responsiveness of the liquidity provider taking the other side of the transaction (with endogenous feedback loops and Volcker both increasing this sensitivity and generally impairing market depth). Critically, as the multiplicative effect of flows on prices continues to grow, these developments can substantially amplify the volatility and tail risk of securities’ return distributions in the presence of coincident, wide-spread investor risk or investment style rotations. Given the incremental market performance benefits of central bank support catalyzed by market structure have been skewed towards passive and momentum investing, my worry is that we could see such a sweeping rotation especially on behalf of retail investors if and when the “Fed put” fades. In this hypothetical context, investors’ lofty forward return expectations incubated since the great financial crisis would presumably meet a much more sober and cash flow-grounded reality, with mean-reversion in valuations accompanied by higher company and sector dispersion. Any correlated investor reaction to this shift would kick off flows that could potentially overwhelm a modern market structure setting calibrated for the efficient execution of smaller orders at minimal investment fees. Given our above analysis, the diminishment of the market’s structural price buffering mechanisms may therefore give it a to-date unseen propensity for flow-based, self-reinforcing price fragility.
1 Kenechukwu Anadu, Mathias Kruttli, Patrick McCabe, and Emilio Osambela, “The Shift from Active to Passive Investing: Risks to Financial Stability?” (August 2018), Federal Reserve Bank of Boston Working Paper SRA 18-04
2 Philosophical Economics, “The Paradox of Active Management”, http://www.philosophicaleconomics.com/2016/05/passiveactive/, May 22, 2016
3 Clinton Askew, “Don’t Look for the Needle Just Buy the Haystack – Farewell Jack Bogle.” Citywide Financial Partners, https://www.citywidefinancial.co.uk/dont-look-for- the-needle-just-buy-the-haystack-farewell-jack-bogle/, January 18, 2019
4 Fidelity. “VOO Snapshot.” https://screener.fidelity.com/ftgw/etf/goto/snapshot/snapshot.jhtml?symbols=VOO
YCharts. “VOO Discount or Premium to NAV.” https://ycharts.com/companies/VOO/discount_or_premium_to_nav
5 Xavier Gabaix, Ralph Koijen, “In Search of the Origins of Financial Fluctiations: The Inelastic Markets Hypothesis” (March 2021), Swiss Finance Institute Research Paper
6 Michael Green, “The Perversion of Passive Investment”, interview by Carson Block, Muddy Waters Research, February 10, 2021, https://www.youtube.com/watch?v=Km3_6oD8U7Q
7 Hao Jiang, Dimitri Vayanos, Lu Zheng, “Tracking Biased Weights: Asset Pricing Implications of Value-Weighted Indexing” (December 2020), National Bureau of Economic Research Working Paper 28253
8 Fidelity. “VOO Snapshot.” https://screener.fidelity.com/ftgw/etf/goto/snapshot/snapshot.jhtml?symbols=VOO
9 Stretching Spreads (@FadingRallies), “2/x) I’ve already discussed deteriorating equity market liquidity extensively, but in our overleveraged market the significance and implications of this sinister vulnerability can’t be understated. Liquidity –– most importantly market depth, has been vanishing since Volmageddon.” Twitter, April 6, 2020, https://twitter.com/FadingRallies/status/1379517912587894786/photo/1
10 Mark Sebastian, “How XIV and SVXY Went Off the Rails and Took the Market With Them“, Real Money, https://realmoney.thestreet.com/articles/02/06/2018/how-xiv-and-svxy-went-rails-and-took-market-them, February 6, 2018
11 Marko Kolanovic, Bram Kaplan, “Market and Volatility Commentary: Narrative vs. Flows, Liquidity-Volatility-Flows Feedback Loop, QE/QT and Liquidity”, JP Morgan Global Quantitative & Derivatives Strategy, January 16, 2019, p.2
12 CME Group, “Assessing liquidity – Revisiting whether book depth is a sufficiently representative measure of market liquidity,” https://www.cmegroup.com/education/articles-and-reports/assessing-liquidity.html, June 17, 2020
13 Antoine Fosset, Jean-Philippe Bouchaud, Michael Benzaquen, “Endogenous Liqduitiy Crises” (December 2019), https://ssrn.com/abstract=3496148 or http://dx.doi.org/10.2139/ssrn.3496148
14 Office of the Comptroller of Currency, “Volcker Rule Implementation”, https://www.occ.treas.gov/topics/supervision-and-examination/capital-markets/financial- markets/trading-volcker-rule/volcker-rule-implementation.html
15 Michael Bowe, Olga Kolokolova, Lijie Yu, “The Volcker Rule and the hedge fund liquidity circle” (November 2019), Manchester Business School, https://www.researchgate.net/publication/337313010
16 https://www.federalreserve.gov/monetarypolicy/bst_recenttrends.htm
17 Michael Green, “The Perversion of Passive Investment”, interview by Carson Block, Muddy Waters Research, February 10, 2021, https://www.youtube.com/watch?v=Km3_6oD8U7Q
18 Vicky McKeever, “Millennials Expect the Highest Investment Returns Despite Coronavirus of Any Generation, Study Finds.” CNBC, https://www.cnbc.com/2020/08/12/millennials-expect-the-highest-investment-returns- despite-coronavirus.html, August 12, 2020
19 https://www.aqr.com/Insights/Perspectives/The-Long-Run-Is-Lying-to-You
20 https://medium.com/incerto/the-logic-of-risk-taking-107bf41029d3
